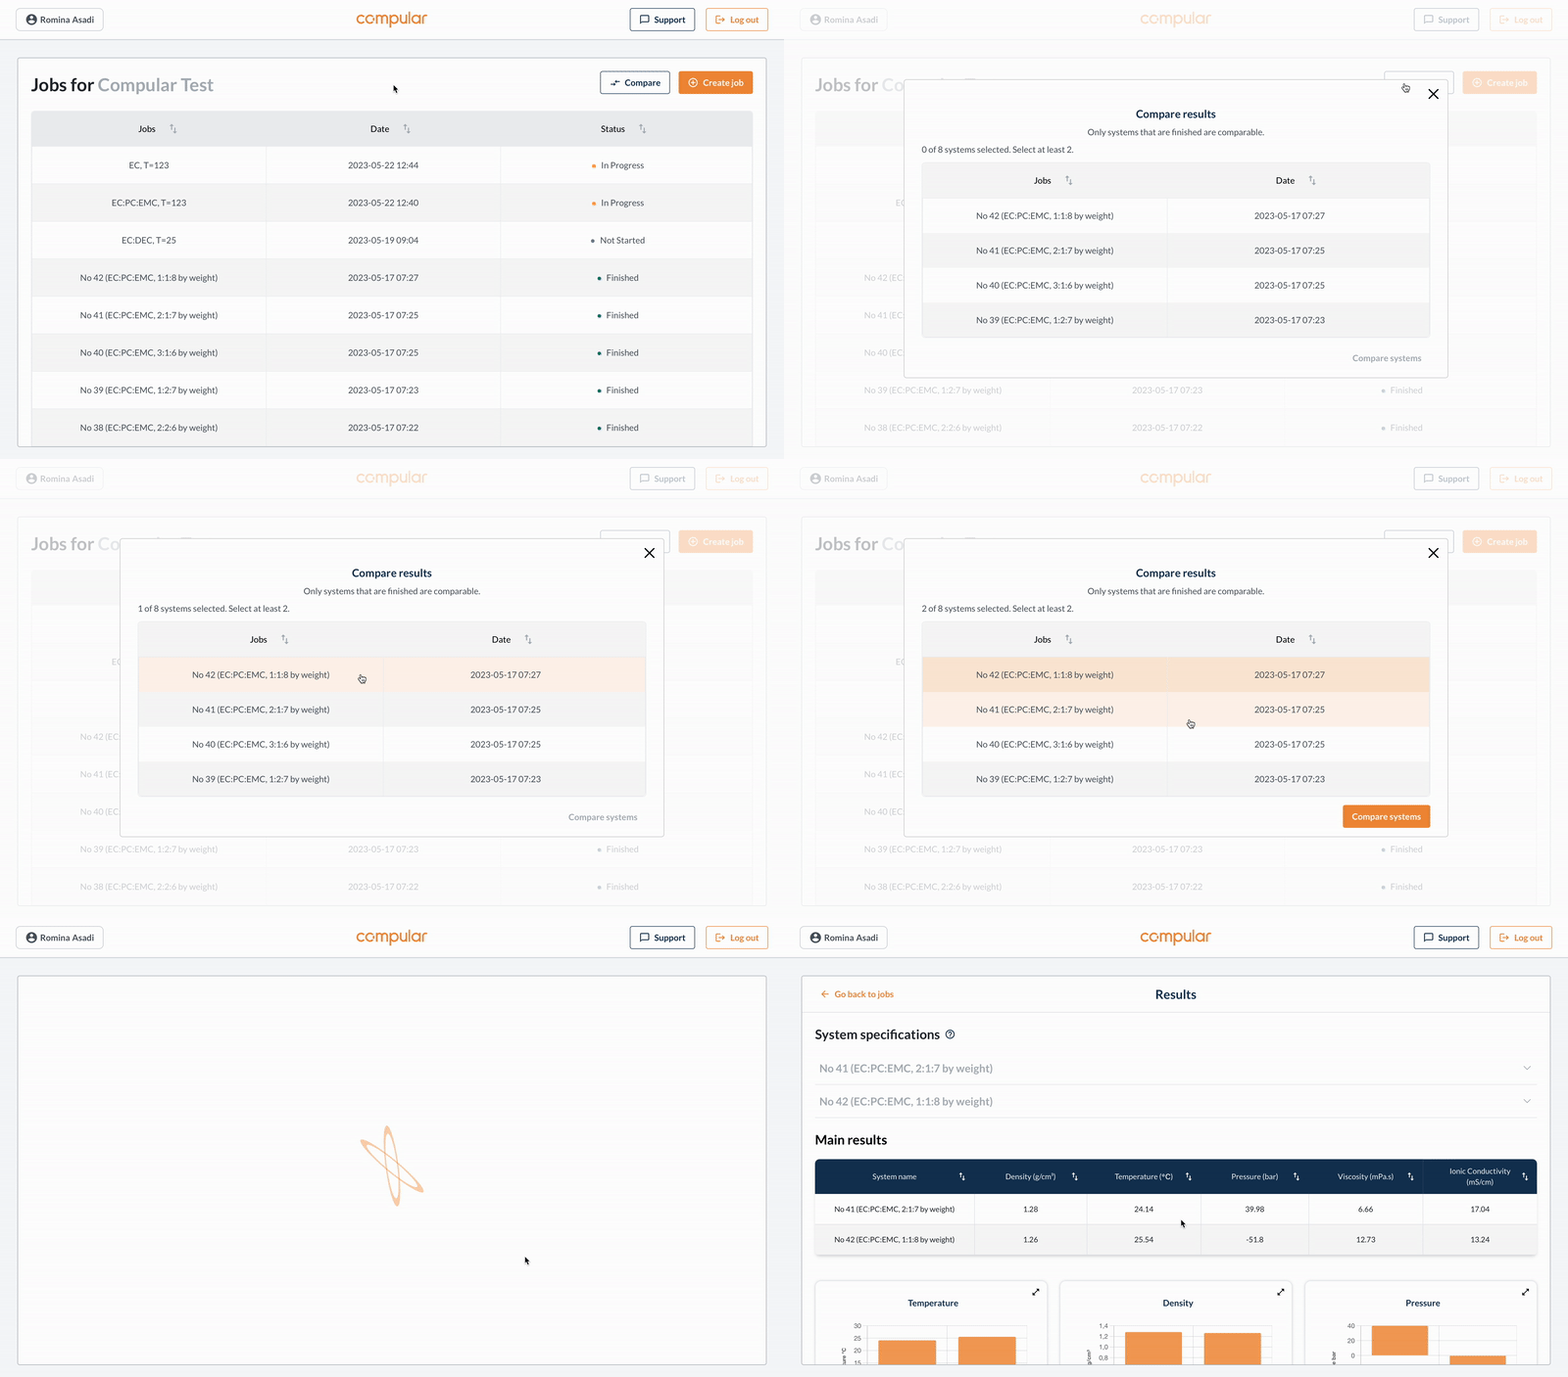
The results page presents a summary of the system specifications along with various types of results. These include results for the whole system, for molecular species and for dynamical species. All results, whether in text or graph format, include error bars for accurate representation.
System specifications #
System specifications are a summary of what you filled in when you created the system. These cannot be edited, and are also visible on the progress page.

Molecular species #
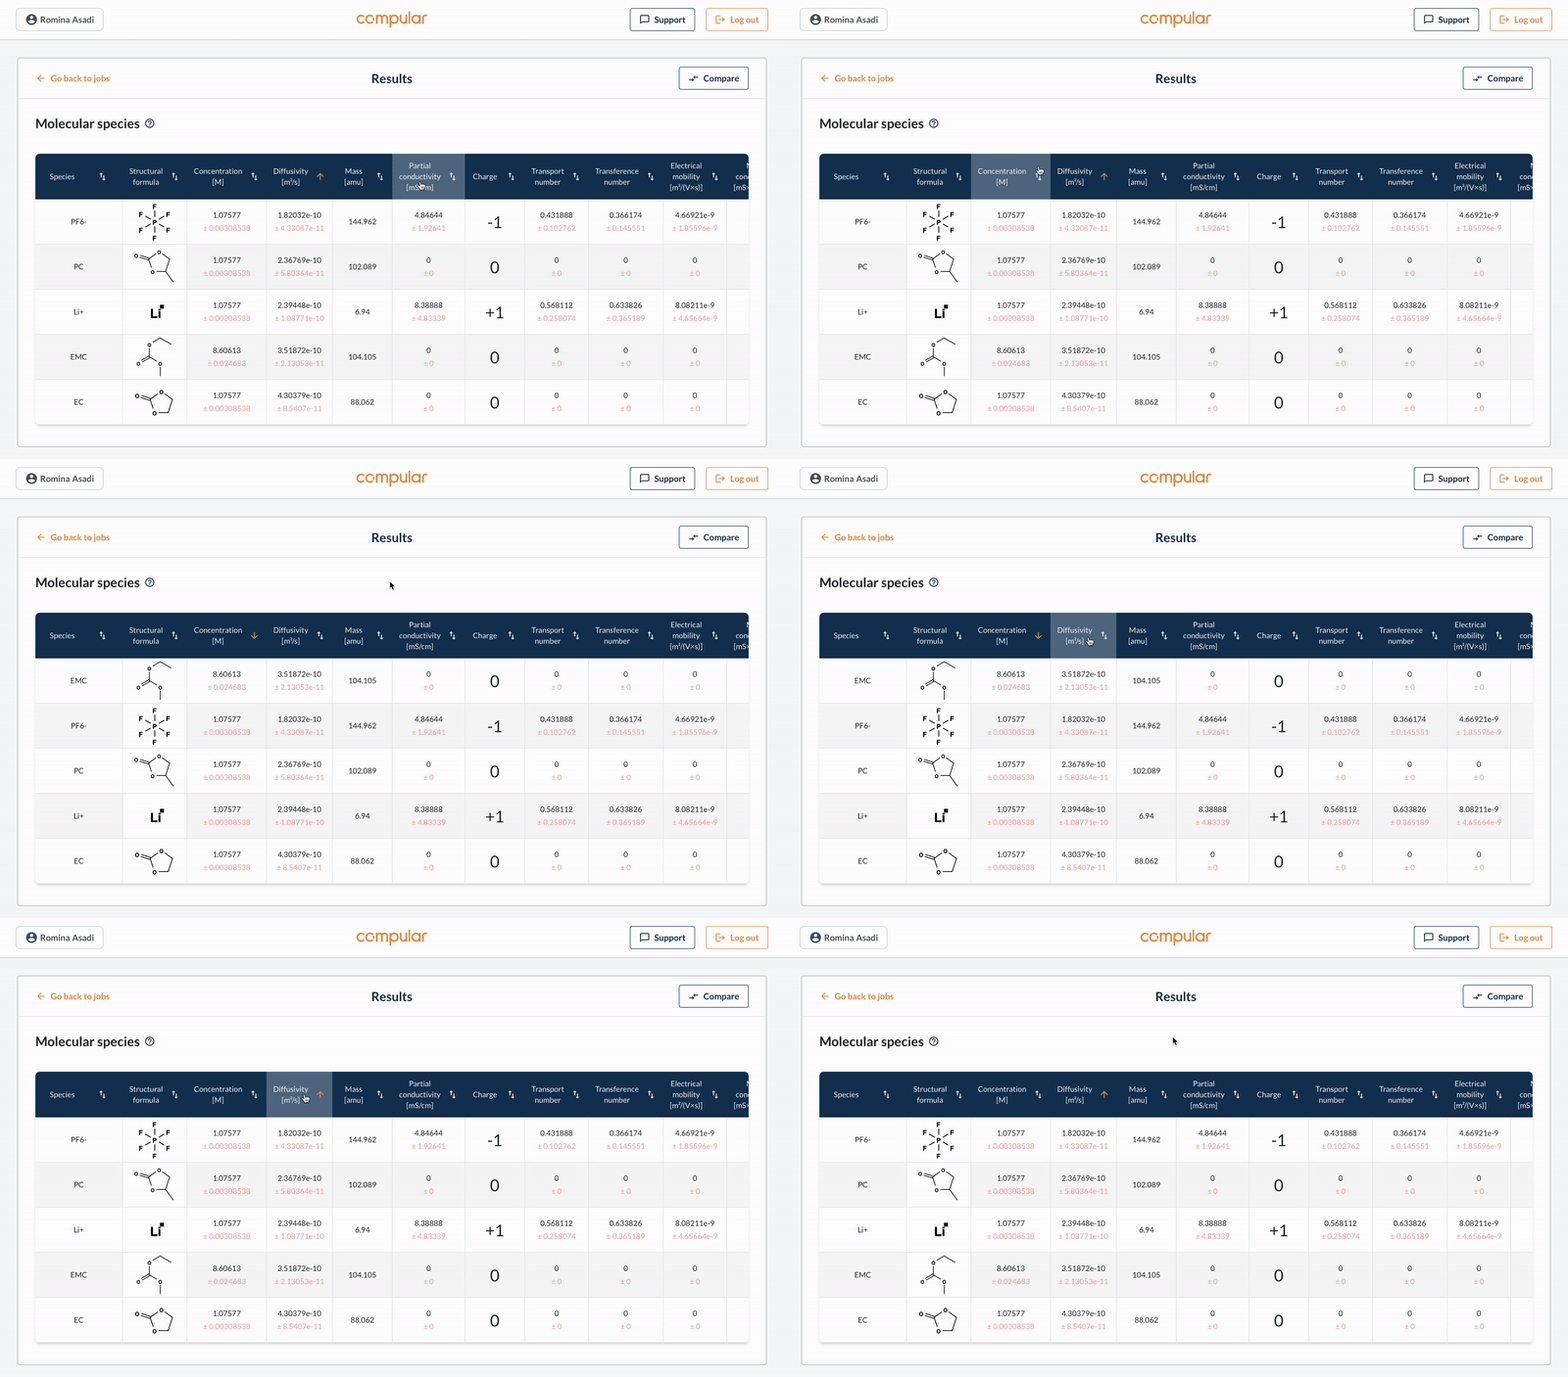
Molecular species are the species of molecules and ions (individual ions rather than salts) that you specified in the input form when creating the system, in addition to any species formed by chemical reactions between species during a simulation. Individual characterization of these species is possible in terms of their concentrations and physicochemical properties.
Dynamic species #
Our dynamic structure discovery algorithm detects dynamic species, which refers to structures that move together as cohesive units. It accomplishes this by identifying pairs of atoms that move as bound pairs. This algorithm detects molecules and ions and how they coordinate to each other over time to form bigger dynamic structures such as 1st solvation shells, solvated ion pairs and ionic aggregates. Different structures are identified as being of the same species if their bond topologies (including noncovalent bonds) are identical. Individual characterization of dynamic species in terms of their (emergent) concentrations and physicochemical properties is possible, similar to molecular species.
Compare results #
It is possible to compare results from several different systems. To initiate the process, simply click on the “Compare” button located either on the job page or on a system’s results page. You have the option to select from all systems that have a status of “Finished.”
The combined results page is similar to the results page for individual systems. The only difference is that it is currently not possible to see combined results for dynamical species.

Interactions #
To reach your wished output, we have made it possible for you to interact with the tables and the graphs on the result pages.
Table interactions #
You can sort all tables by clicking the arrow next to the name in the column header. Additionally, you can expand longer tables by clicking the arrow below the table, allowing you to scroll and access all rows of data.

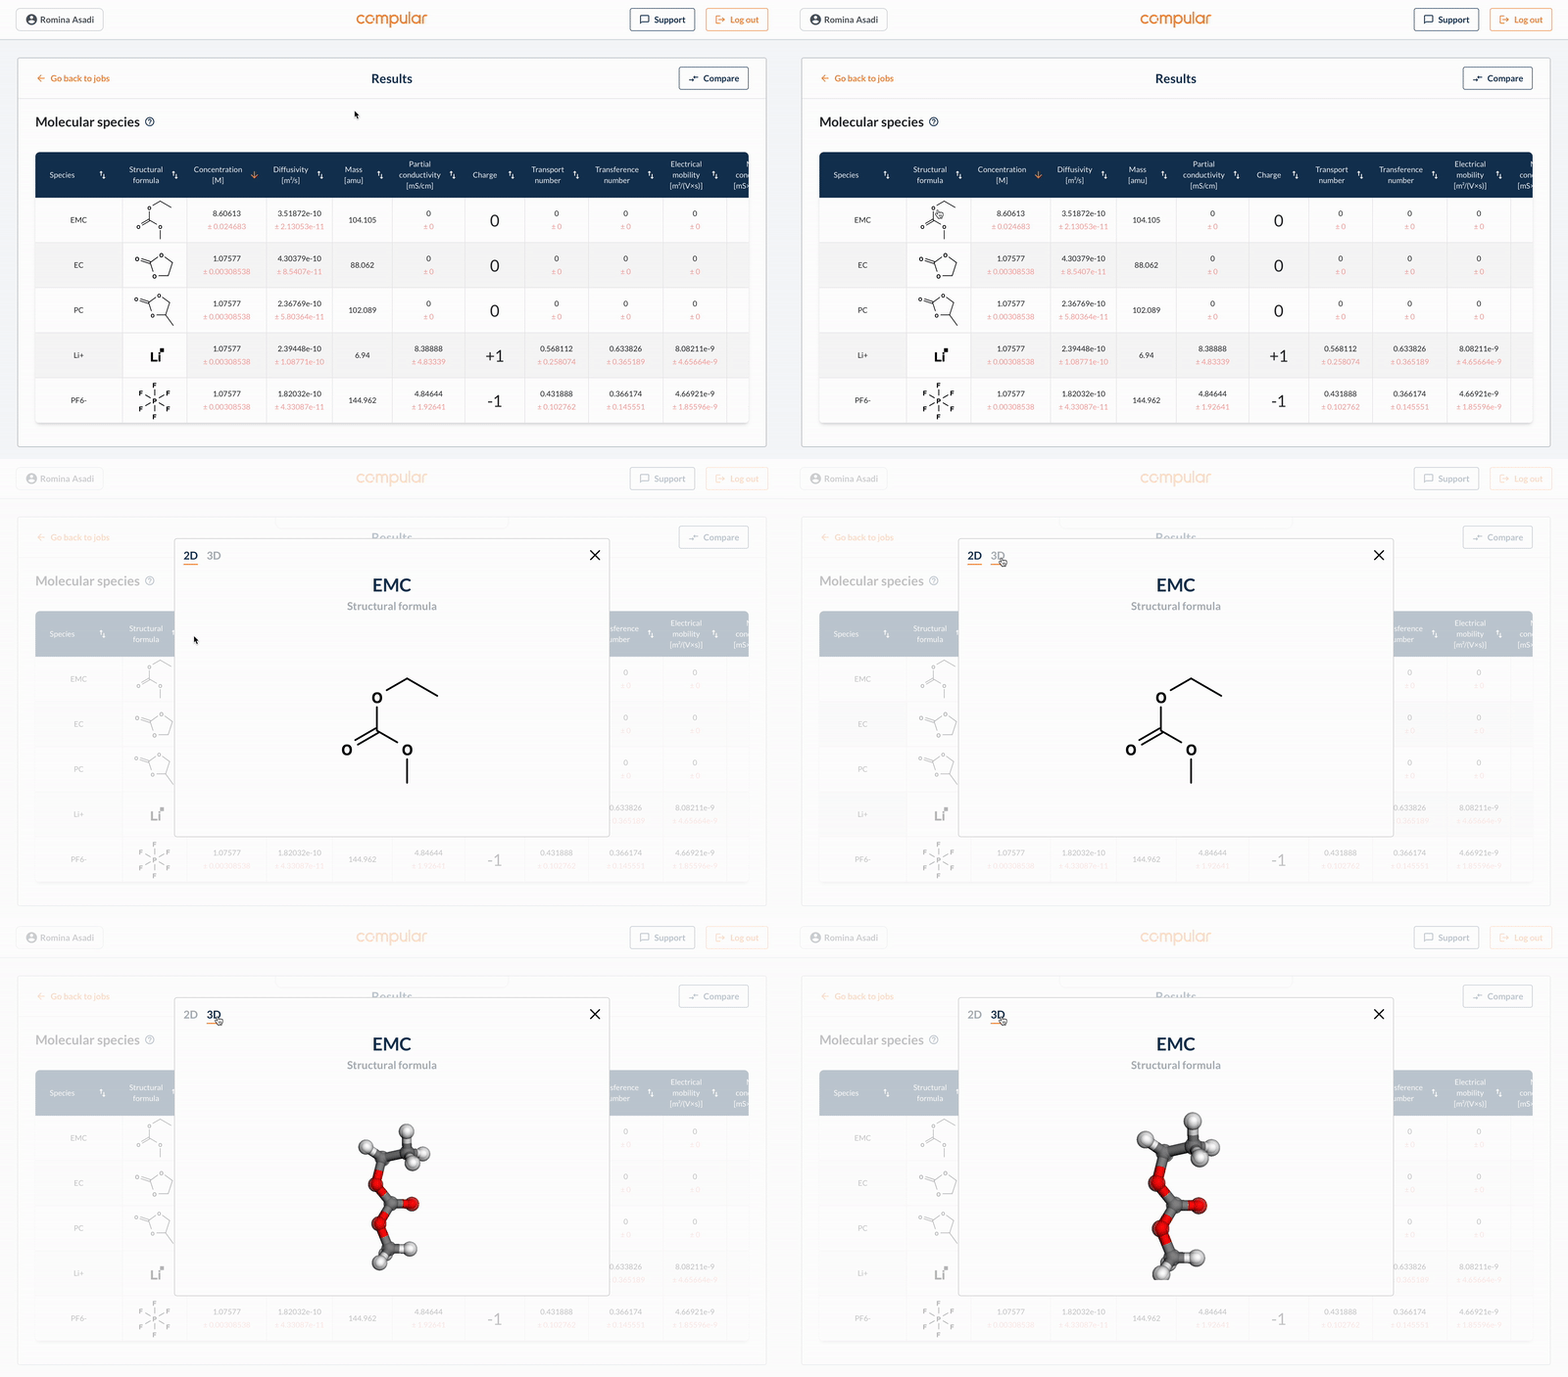
The images in the structural formula column can be expanded by clicking on them. This allows you to view the structure in both 2D and 3D by clicking on the different tabs. In the 3D format, you can interact with the structure by rotating with the left mouse button and zooming in and out with the mouse scroll.

Graph interactions #
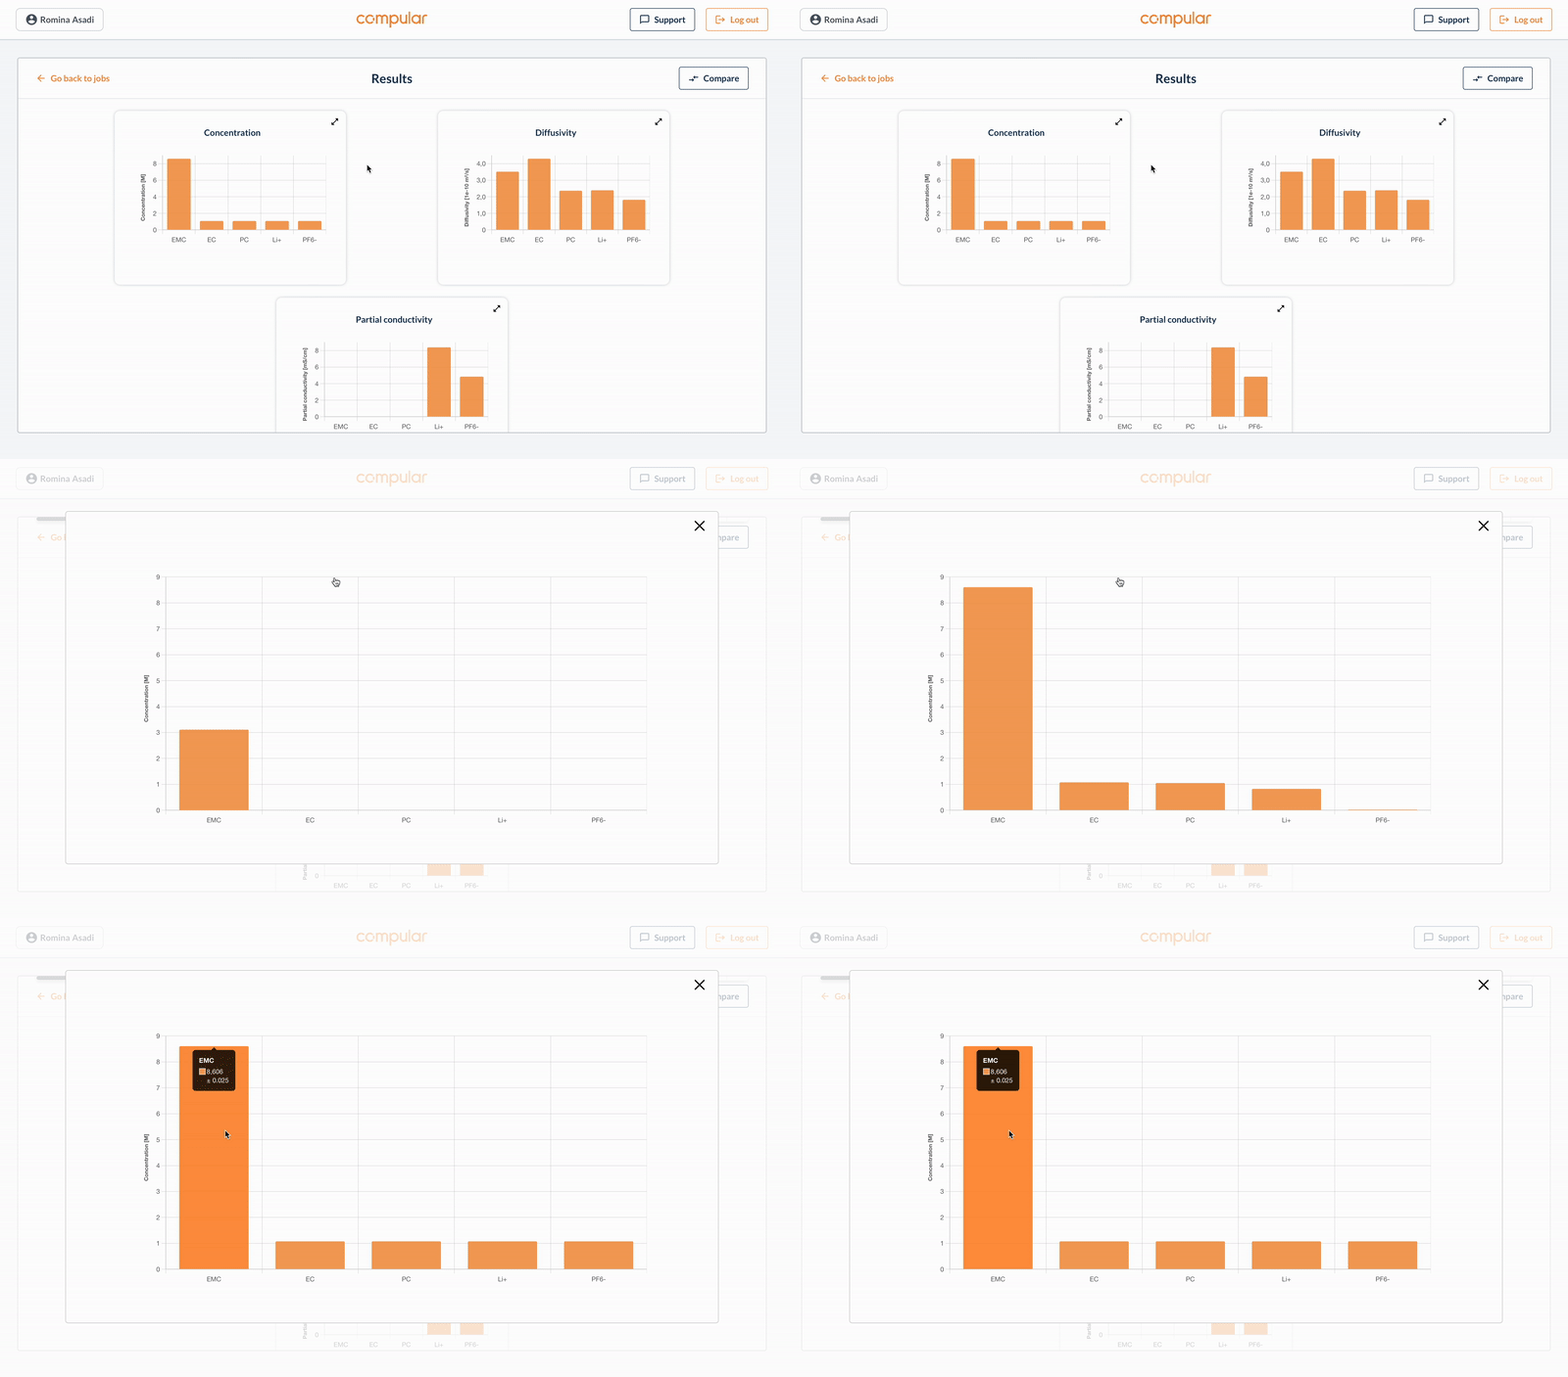
The graphs are presented in so-called “cards”. Currently, it is only possible to see the data in bar charts. Clicking the icon in the top right corner expands these cards, enabling the display of additional bars.
By hovering the mouse over the bars, you get access to more information about the specific bar. This includes its name, exact value and its error value. The hover functionality is possible both in the card’s original mode and its expanded mode.

