Setting up simulations
Generating geometries
Running simulations
Analysing data
Visualising results
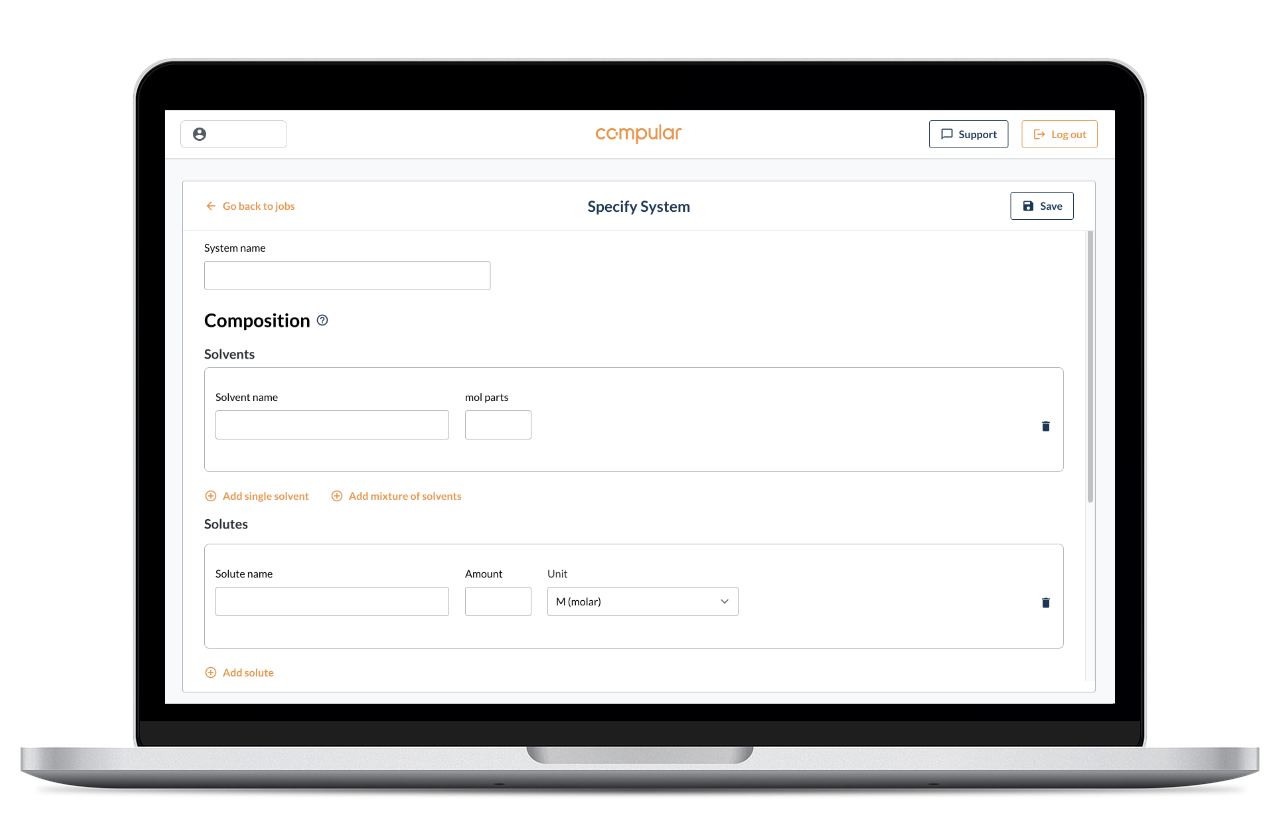
Setting up simulations
The user simply specifies the system composition, the physical conditions and the target properties to be predicted. Based on this information the software automatically selects simulation package, level of theory and suitable simulation parameters, and sets up the full simulation case, saving time and eliminating the need for computational expertise. This is possible because we carefully validate new features for different classes of materials before launching them.
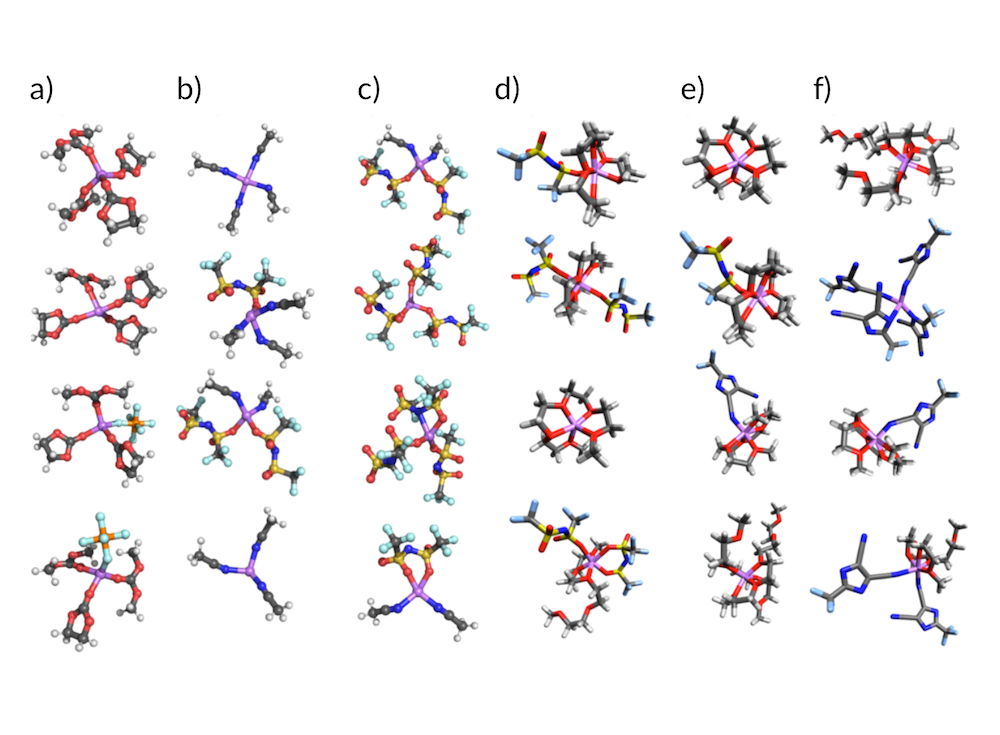
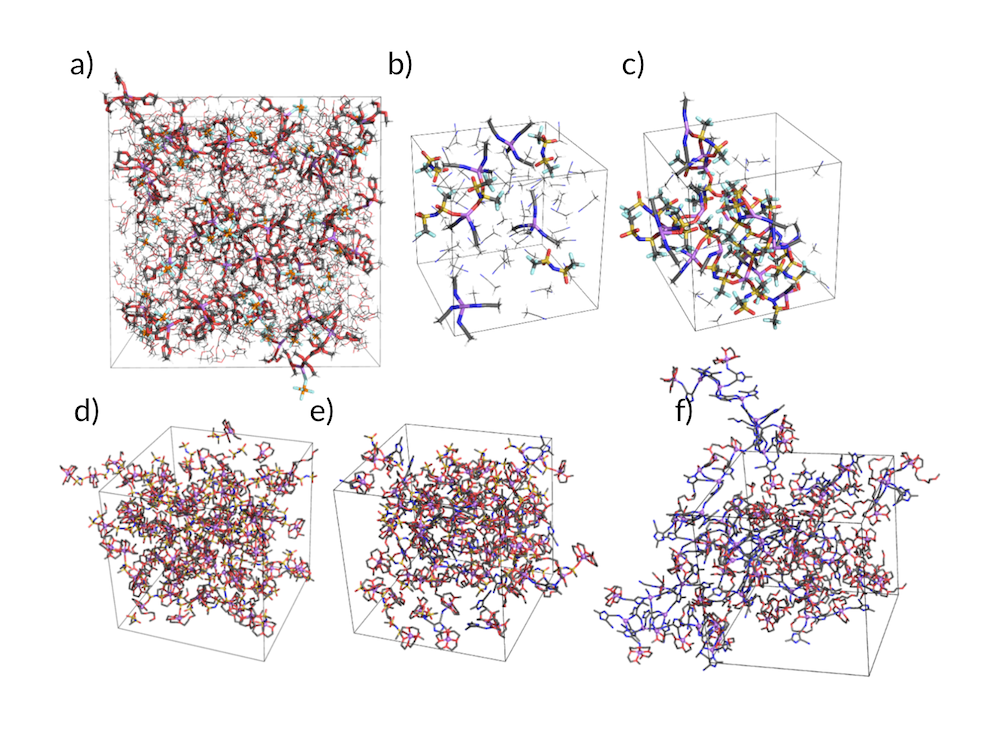
Generating geometries
Crystalline structures are generated by repeating a unit cell and adding optional defects at a fraction of sites. Amorphous systems are generated by randomizing a starting geometry and relaxing it until atoms are not unreasonably close given the material composition and density. Composites and liquid/solid systems are generated by combining separately generated regions. The user just needs to give the minimum needed information for our system builder to do the rest.
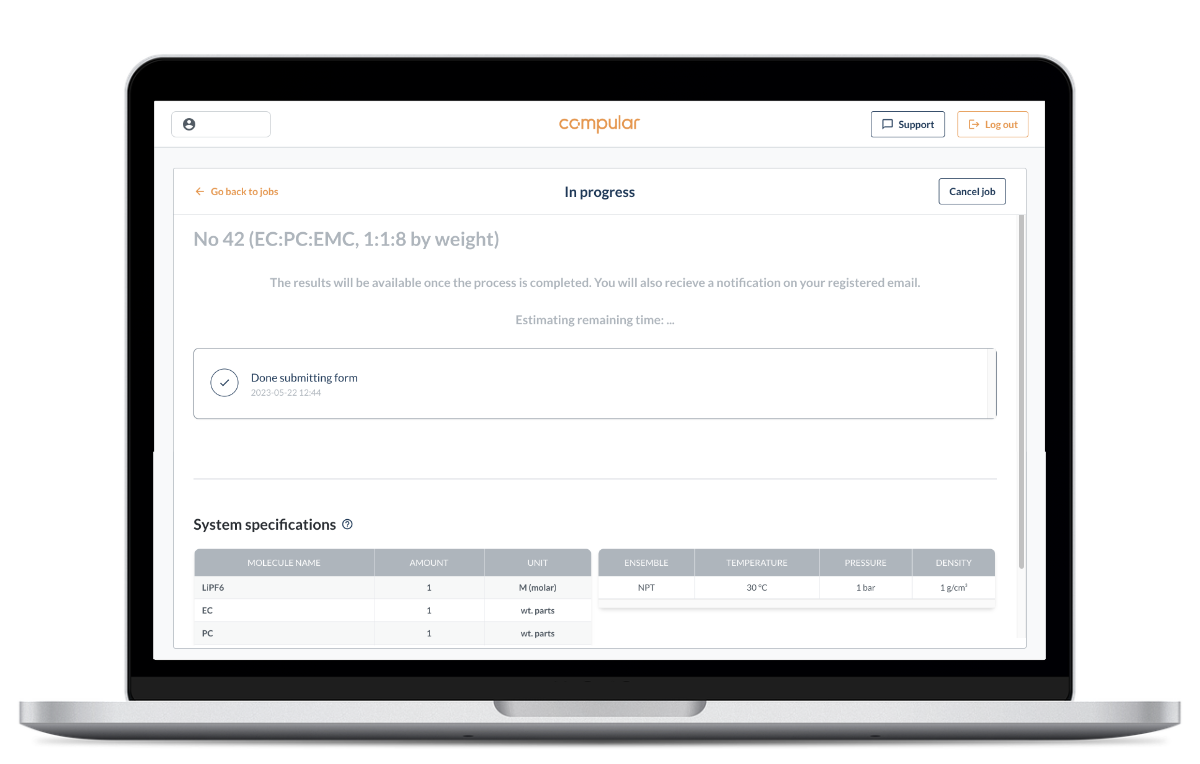
Running simulations
The simulations are automatically submitted to our elastic compute cloud and dispatched to hardware optimized for each job. The user can track the progress of running simulations from the app. We use different well-established third-party simulation software packages for different types of simulations and classes of materials to get the best trade-off between accuracy and performance in each case.
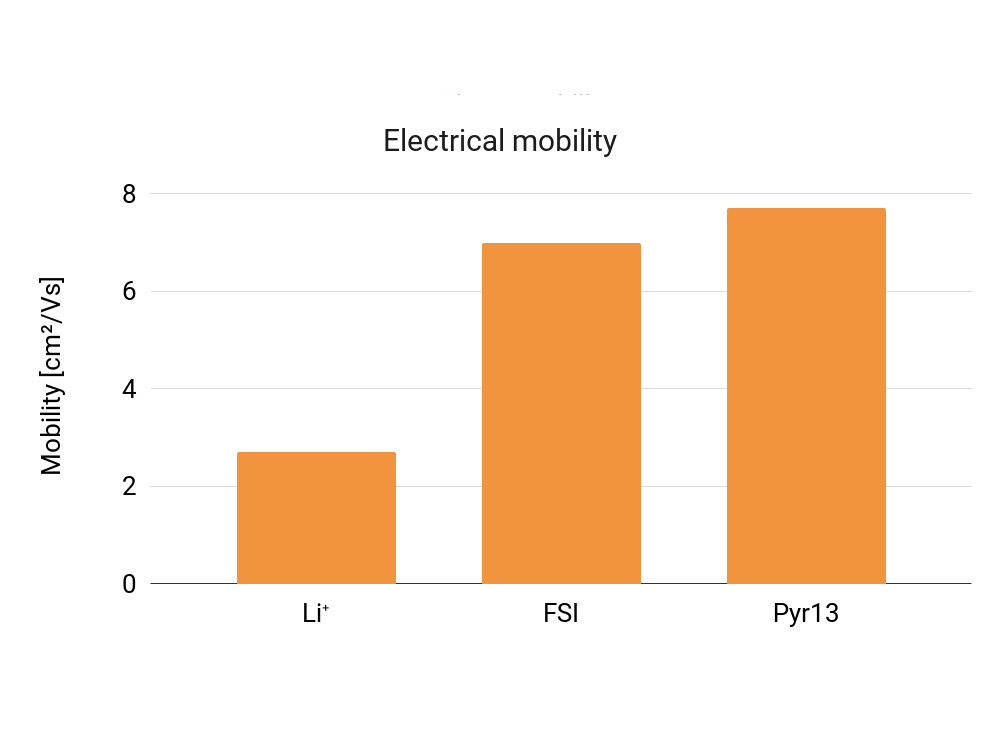
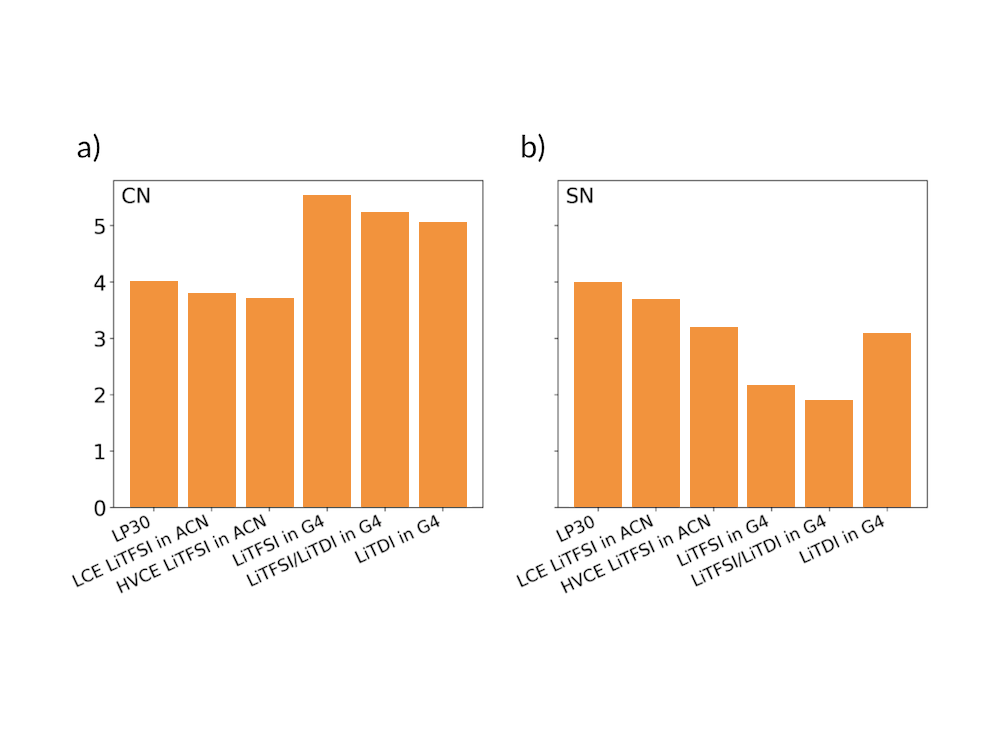
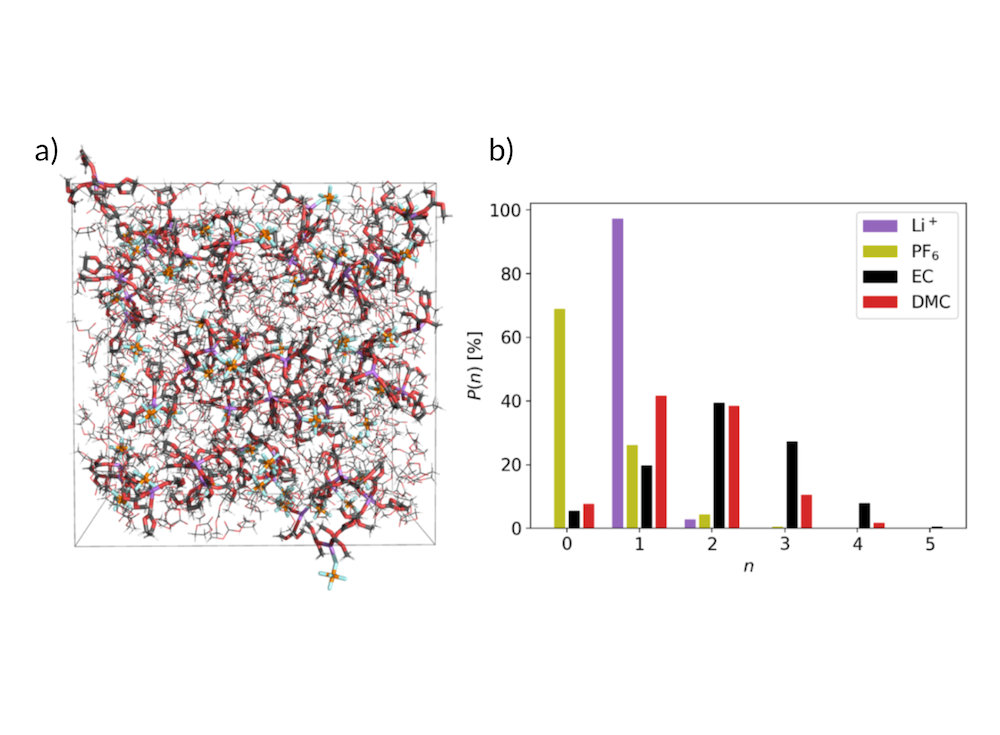
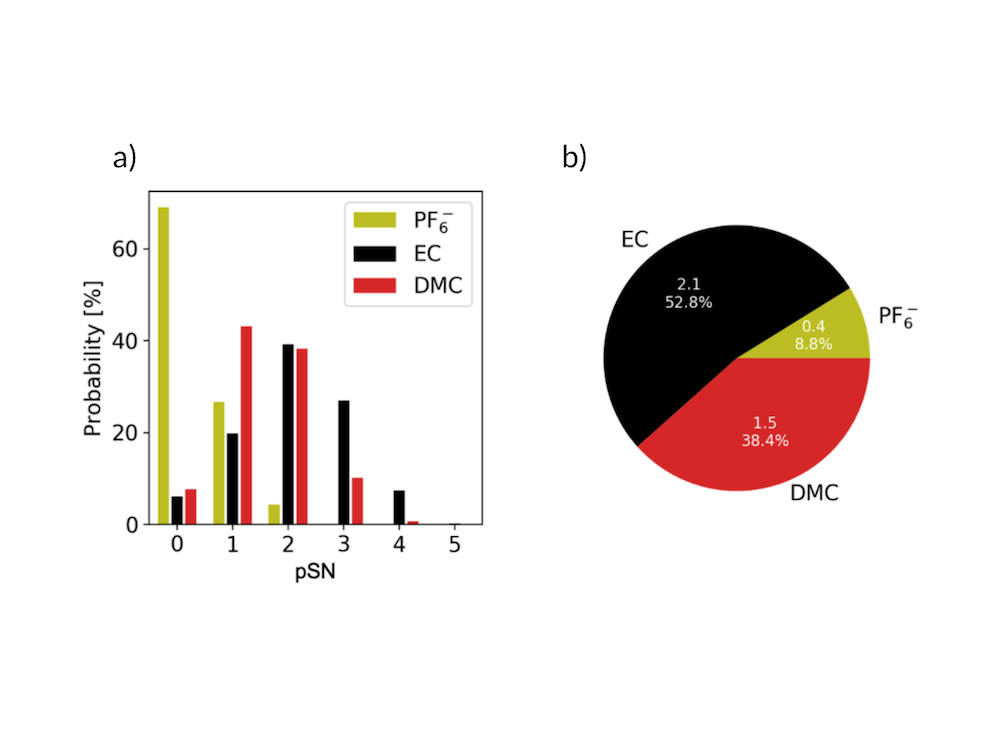
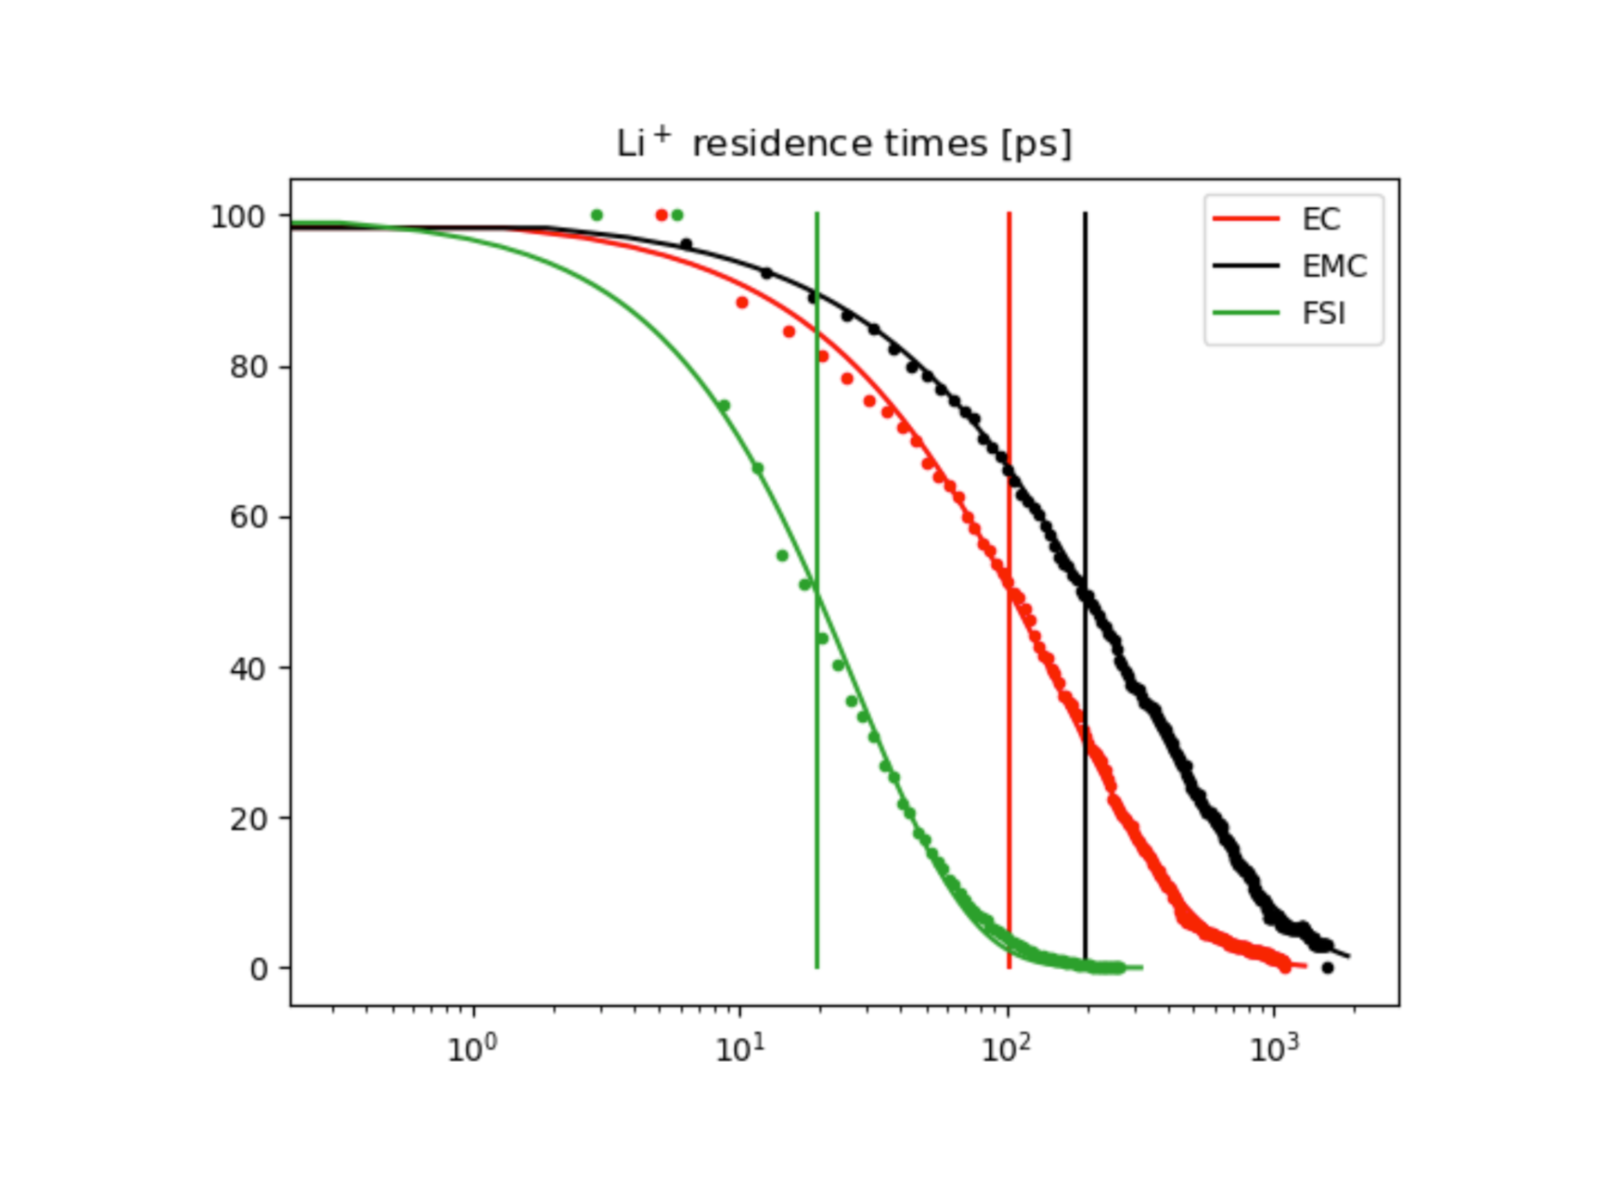
Analysing data
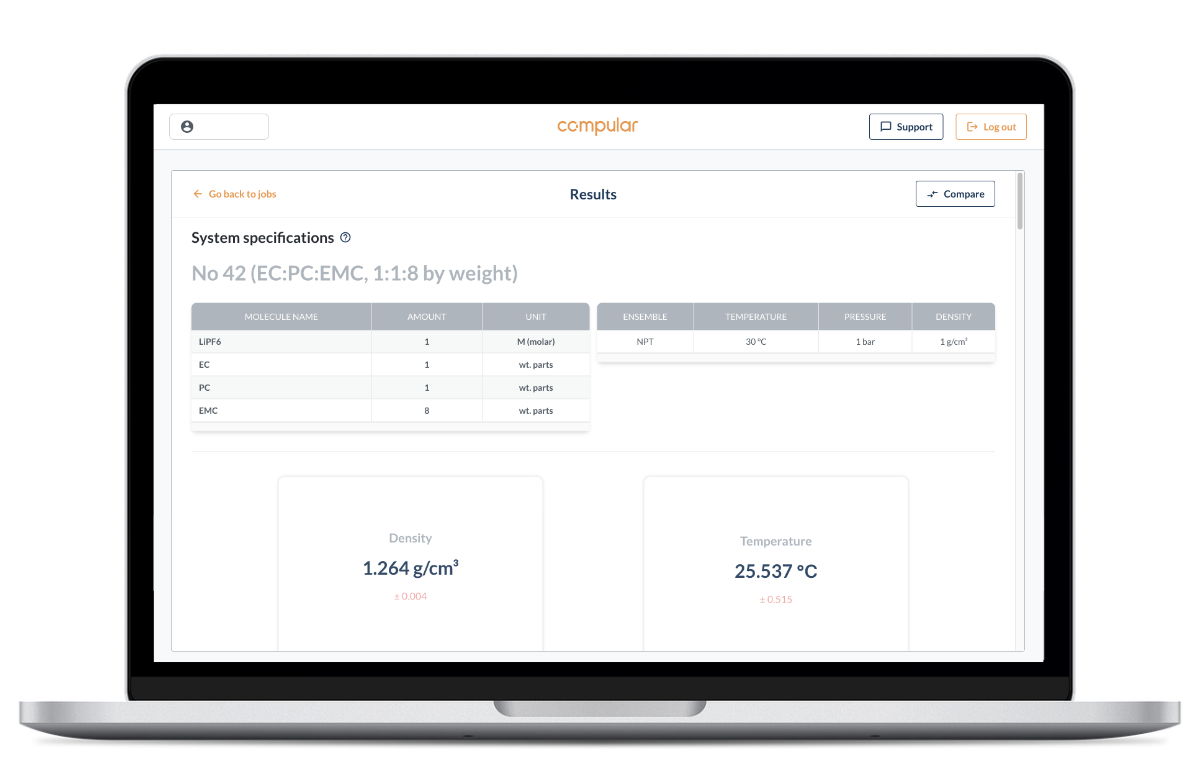
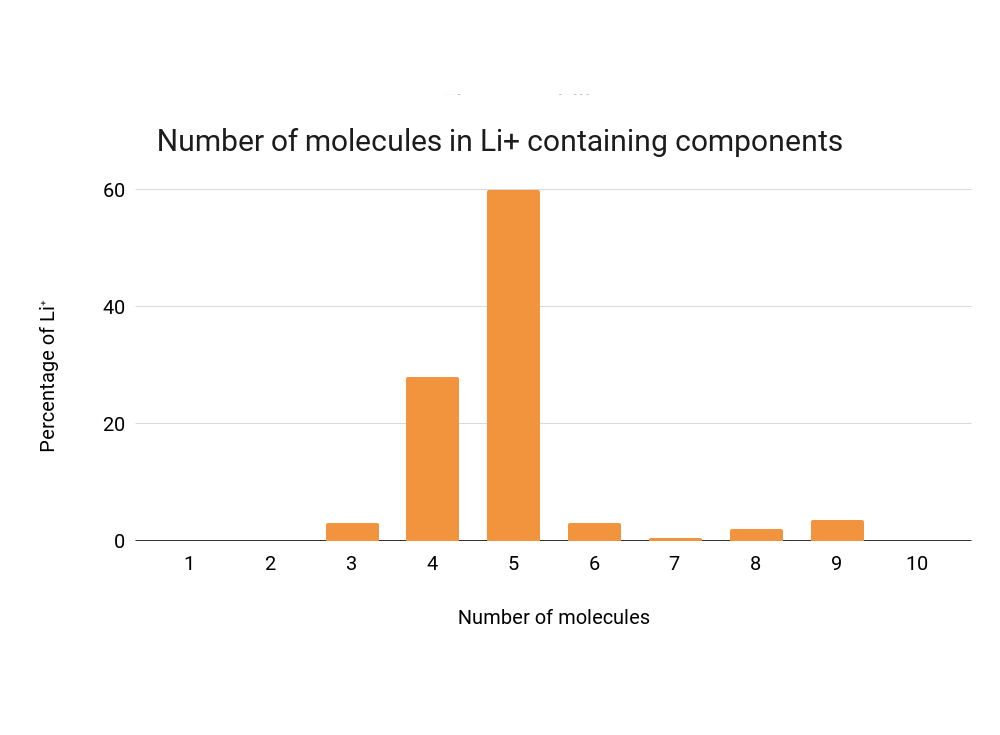
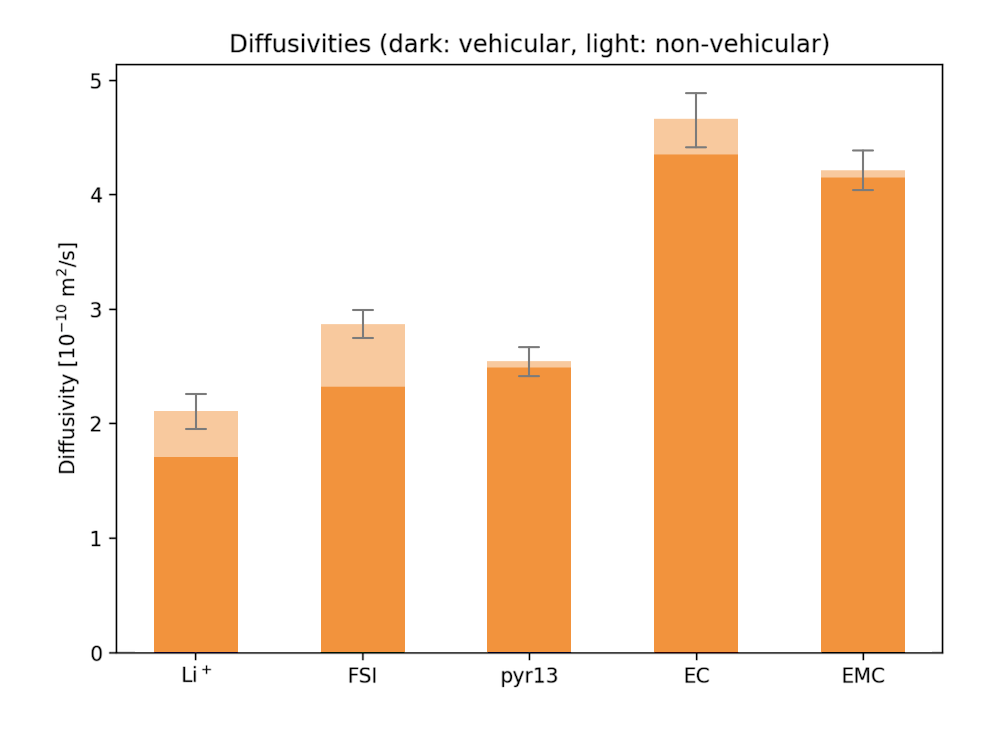
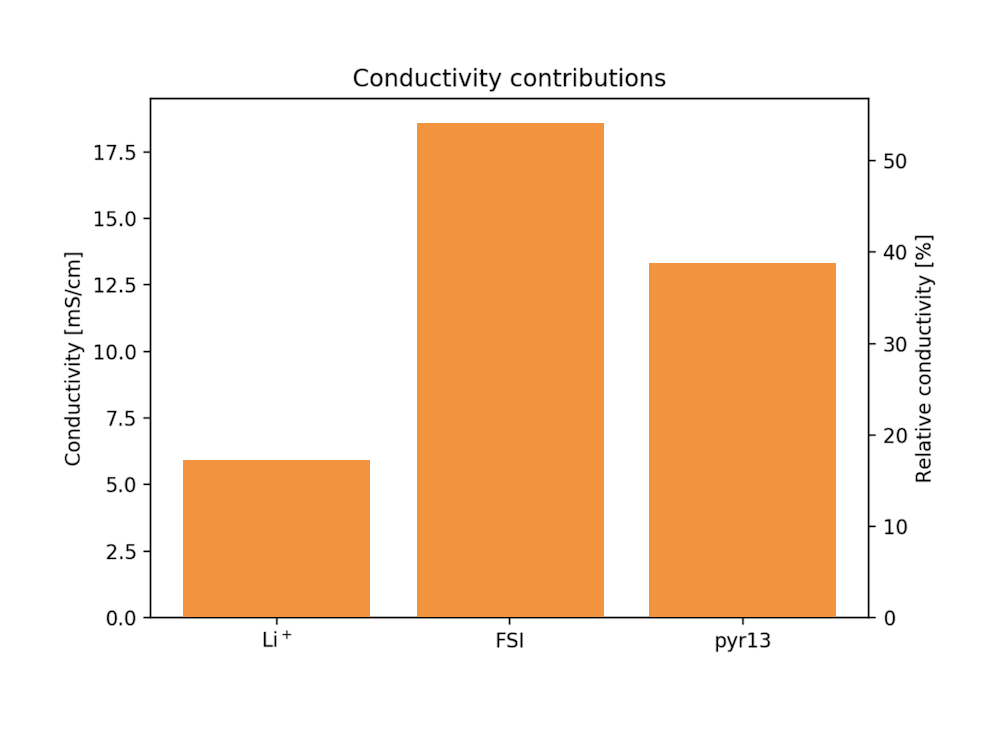
Visualising results
All simulation and analysis data is stored in a structured manner in our databases, or downloaded to your own data stores, and can be queried by our app locally or in the cloud. Based on the material properties requested by the user, an automatic dashboard will be generated to visualize the results in a default presentation. Results for different systems can also be compared. The data can be accessed by a Python API within the app, enabling custom scripting and visualisation. Graphs, tables and raw data can also be exported.